
Measuring Business Performance
And How to Visualize Trends
If you are one of the many business owners wearing multiple hats, examining your finances could fall lower on your priority list. For us business owners, sometimes we focus more on the daily operations or bringing in new business rather than examining the level of past performance and planning for the future. While satisfying the newest and current customers is high-priority, it is just as important to review past metrics to see how your business units are performing over time.
Common approaches to financial analysis for small businesses are producing meaningful monthly reports for newer businesses or quarterly financial reports for more established businesses. Investors or loan officers most certainly will examine financial statements, and taking your measurements a step further with visual trends may help you as a business owner better understand how your business grows and expands over time.
We recently attended an SBA workshop focused on writing and improving a business plan. An integral part of the business plan is financial statements and projections for the future, so we started assembling financial reports. To my displeasure, it didn't turn out to be as exciting as expected, as numbers on paper just didn't have the same appeal as seeing graphs and trends of the data. Perhaps this was due to my background in engineering, where plotting results and trends over time proved to be a valuable tool in problem-solving and analysis. Generating financial statements proved to be a useful exercise because with this important data in our system we are able to make meaningful graphs to better interpret the data along with the numerical reports like balance sheet, income statement, and cash flow summary. Let's take a look at a sample plot summarizing sales by month.
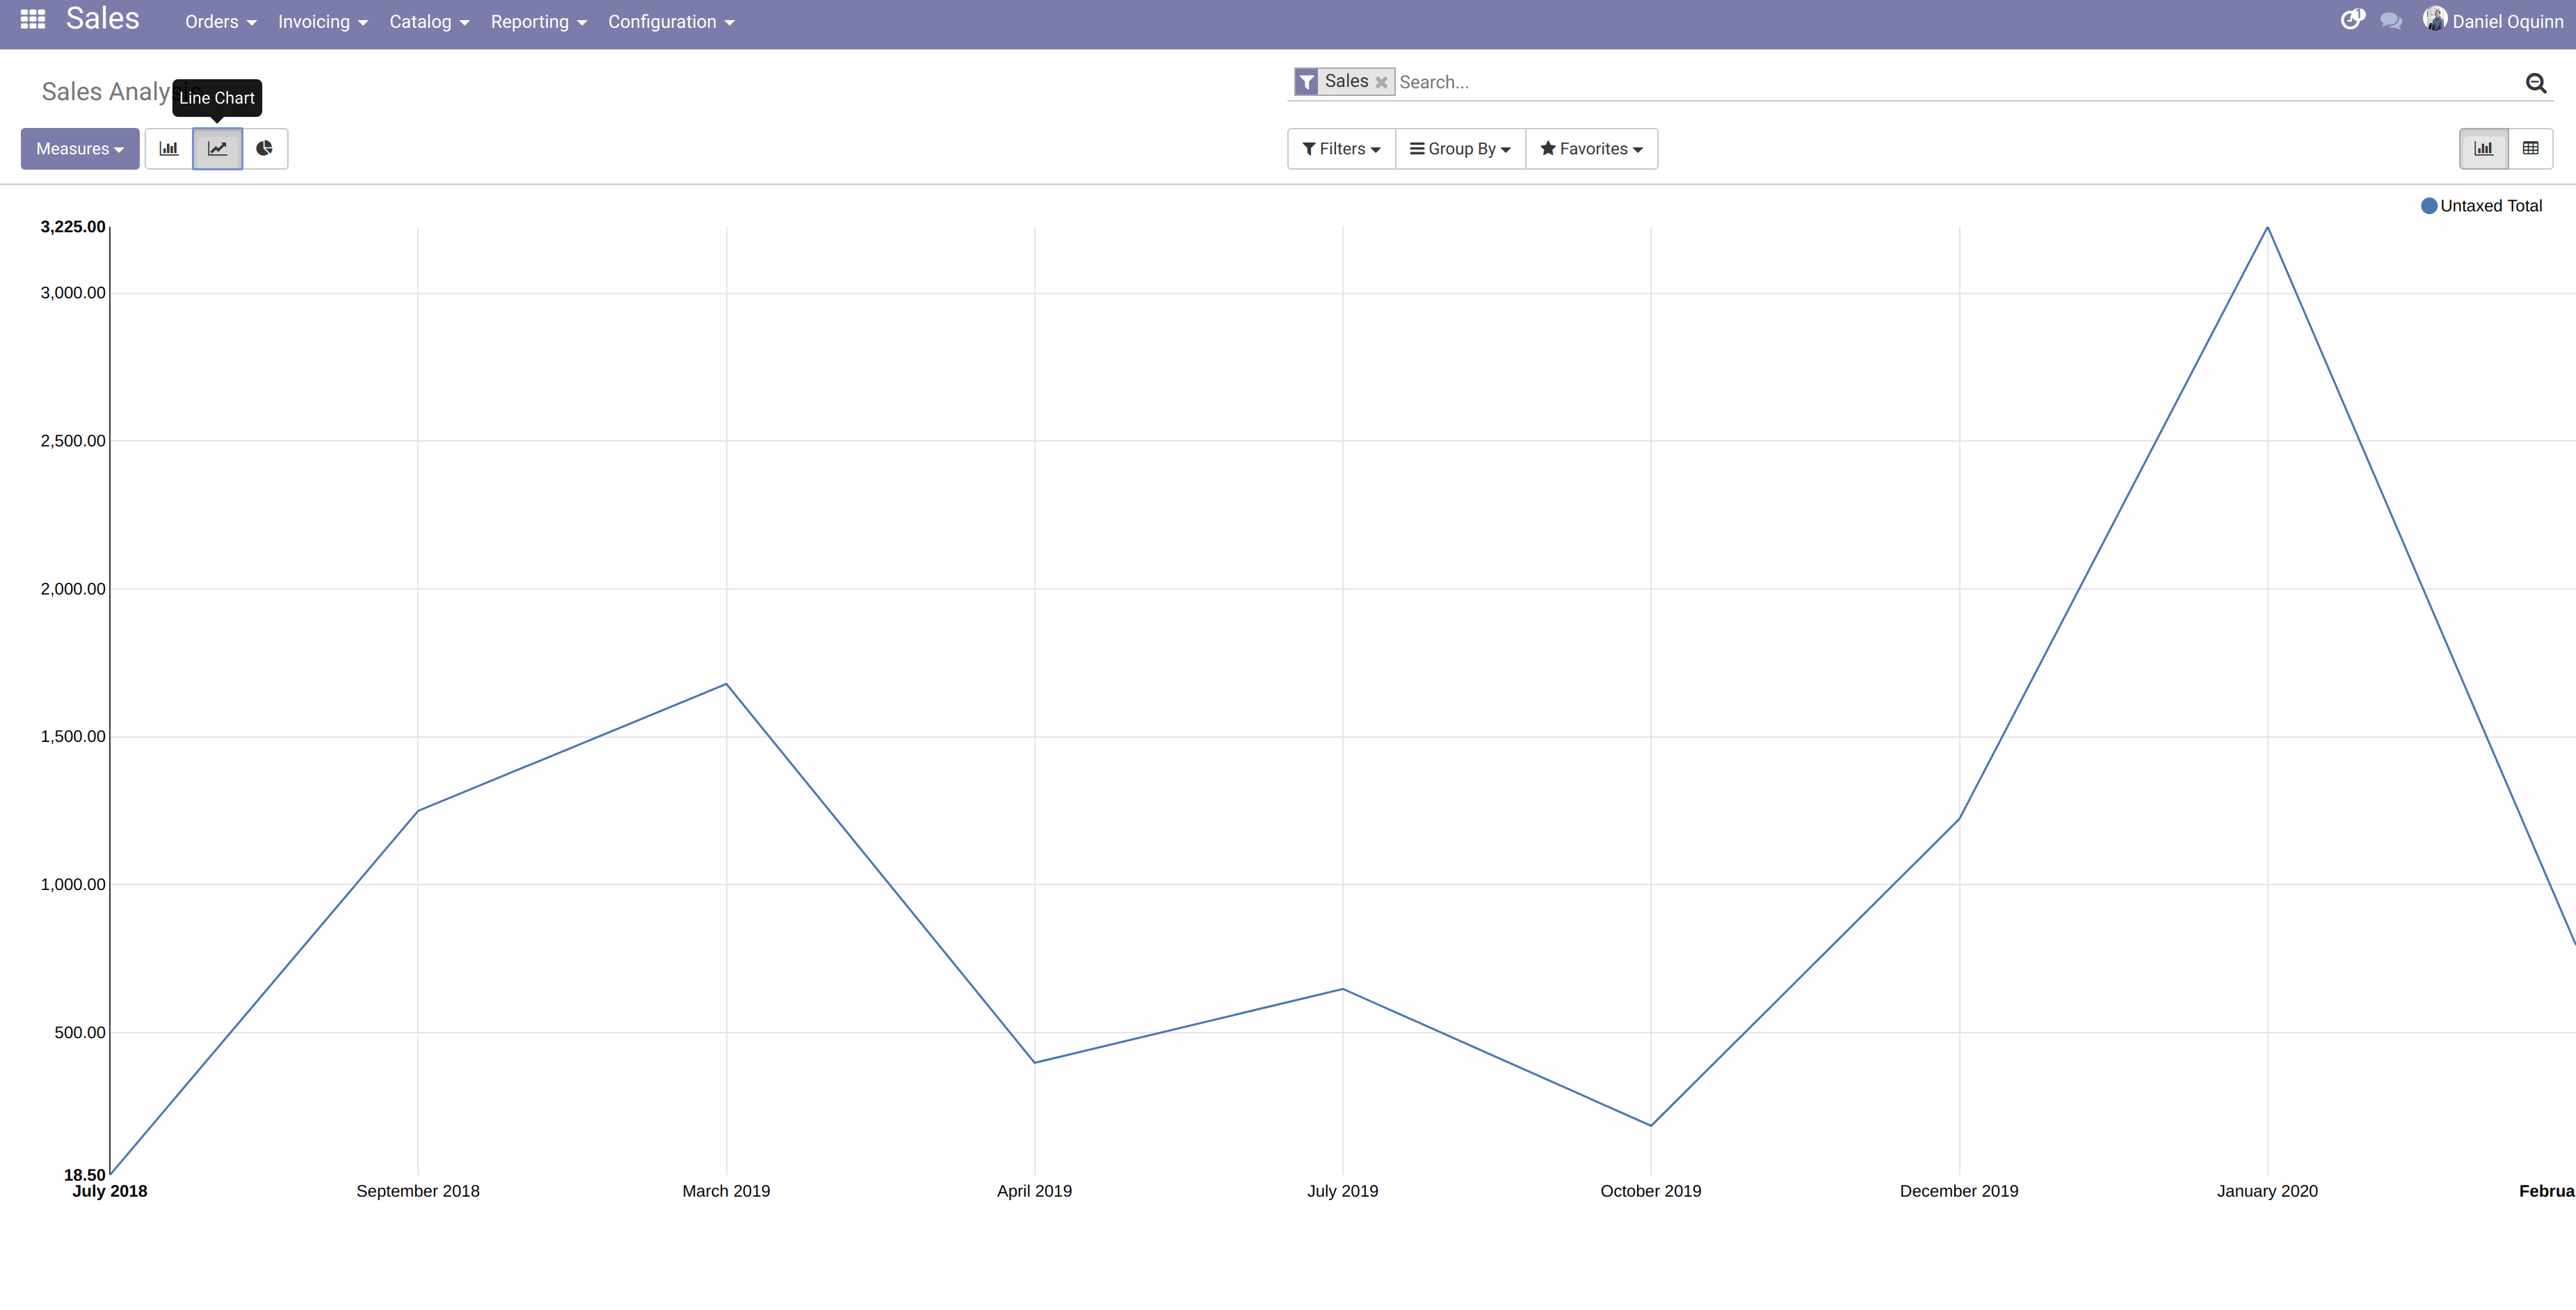
Having the ability to plot performance in a standardized manner is a great tool to have at your fingertips, and since the sales and expense data is stored in a central location, creating such plots is as simple as a button click, provided you are actively managing your business and sales data.
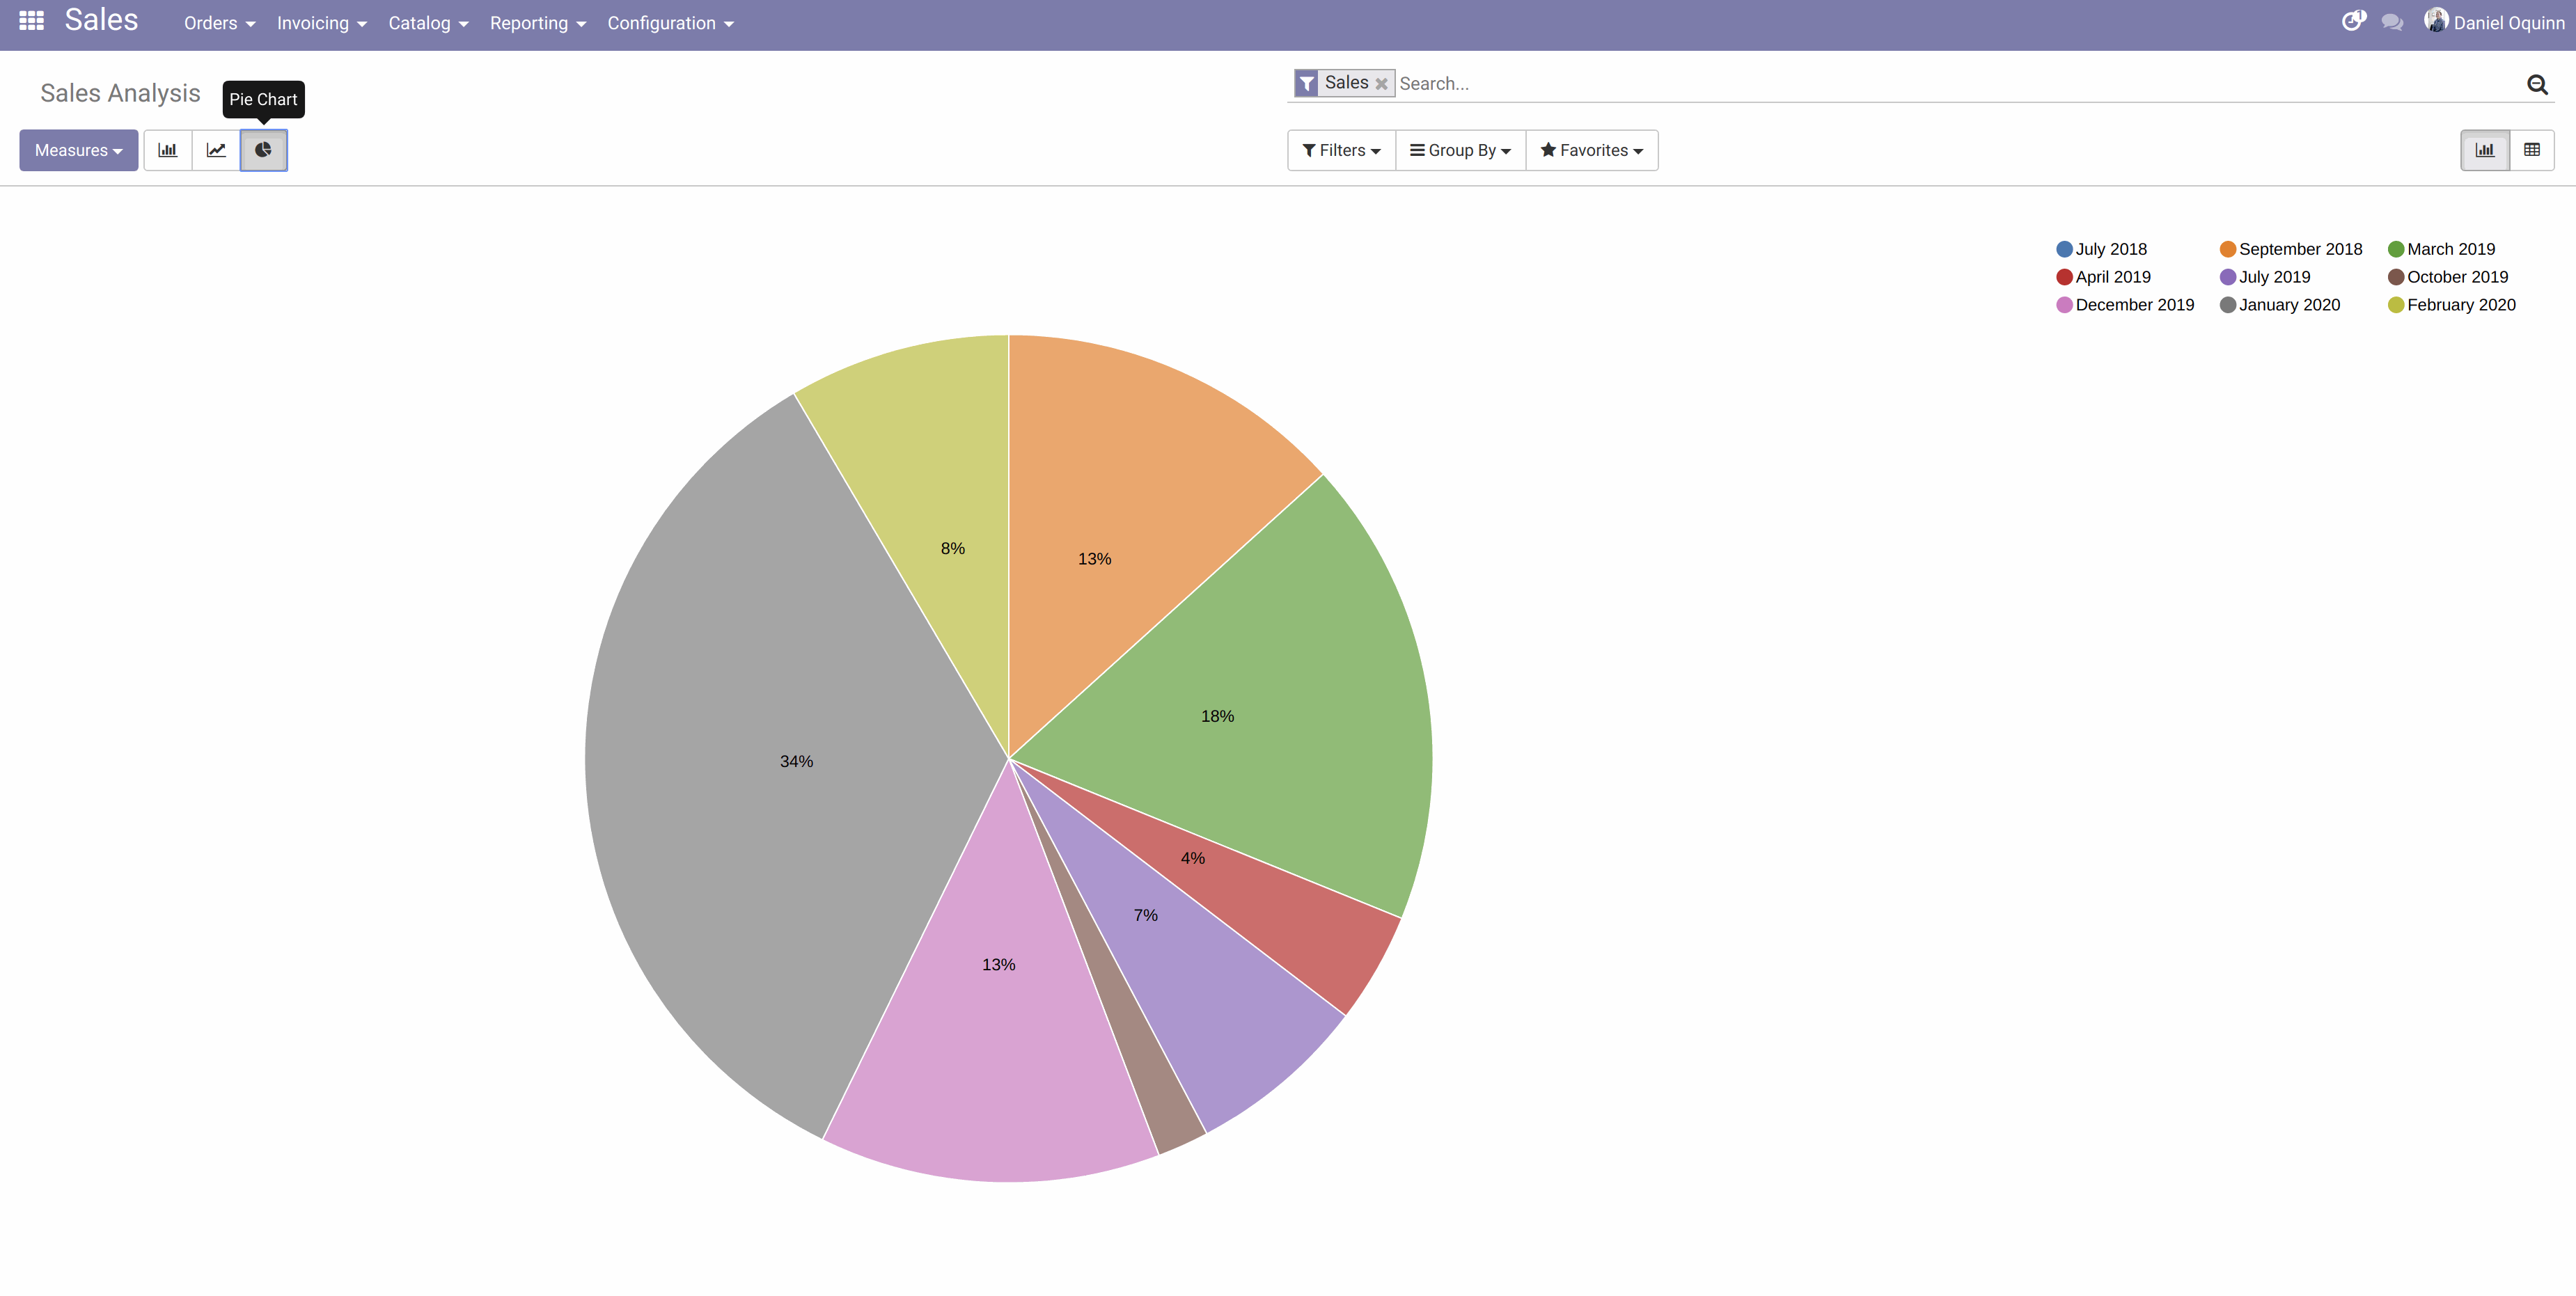
Analyzing seasonal trends within your business is important too, and viewing your data in different formats will depict trends that you may not even know are occurring. Below is a graph splitting up the sales data into a pie chart by month. Our business is not dependent on season, so the chart below may be more helpful for businesses in the farming or landscaping industries.
As your sales and other data grow hopefully exponentially over time, it is important to measure success and analyze failures. Having a visual representation of the data has proved helpful for us, as we constantly evolve our business process and try new approaches. If you are a small business owner, having tools to analyze numerical performance, keeping tabs on what techniques work well and which don't, like a CRM are advisable. Today there are so many choices available for business operations, be sure to choose one that suits your needs and is extensible and customizable to fit your business.
Read Another Article